Introducing a New and Upgraded Reporting Experience
By Yashash Agarwal · 21 Feb 2026
At Gamezop, our focus has always been on delivering exceptional experiences for our Publishers. Today, we are excited to introduce a major upgrade to the Gamezop Business dashboard. The new reporting experience gives Publishers deeper visibility into their revenue data, making it easier to analyze performance and make informed decisions.
Who are Gamezop Publishers?
Gamezop operates multiple plug-and-play products across content categories (viz., games, quizzes, astrology, news, and cricket). Gamezop Publishers are apps and websites that embed one or more of our products to grow user engagement and advertising revenue.
Why do we need a new reporting experience?
When Publishers send users to our products, we generate advertising revenue, which is shared with them. Our Publishers get access to their revenue data in real time on the Gamezop Business dashboard.
Today, Gamezop works with more than 10,000 apps and websites. Each partner brings unique traffic sources, audiences, geographies, and platforms, whether app or web, mobile or desktop. In ad monetisation, fluctuations in revenue and eCPM are common. This makes it essential for our teams to continuously monitor multiple revenue variables, quickly identify unexplained changes, and resolve issues before they impact partner earnings.
At this scale, complexity grows rapidly. Revenue and eCPM are influenced by several factors including geography, ad formats and sizes, platforms, and traffic source such as in-app web or external browsers. Because of this, studying data only at a partner level is not sufficient. To accurately understand performance and identify anomalies, we need to drill down into smaller cohorts where traffic characteristics are consistent and revenue patterns can be meaningfully compared.
With 10,000 partners, each sending users from an average of 10 to 12 countries, across multiple ad sizes and traffic sources, this quickly translates into hundreds of thousands of data points that must be analyzed and monitored continuously.
As we continue building systems to automate this level of analysis internally, we also wanted to give our partners the ability to do the same. While the existing reporting experience offers some visibility, this is an area where we must keep improving to make deeper insights more accessible and actionable.
In many cases, partners are best positioned to understand sudden changes in performance. While our teams may spend time investigating why a partner’s revenue from a specific geography is declining, the partner may quickly connect it to a recent app release or a change in webview settings that is being gradually rolled out and needs correction. The goal of the new reporting experience is to bring this level of clarity directly to our partners, so issues can be identified and resolved faster.
What to expect with this reporting experience upgrade?
The new reporting experience has been rolling out to Gamezop Business Publishers since early February 2026. Here are the four most meaningful updates:
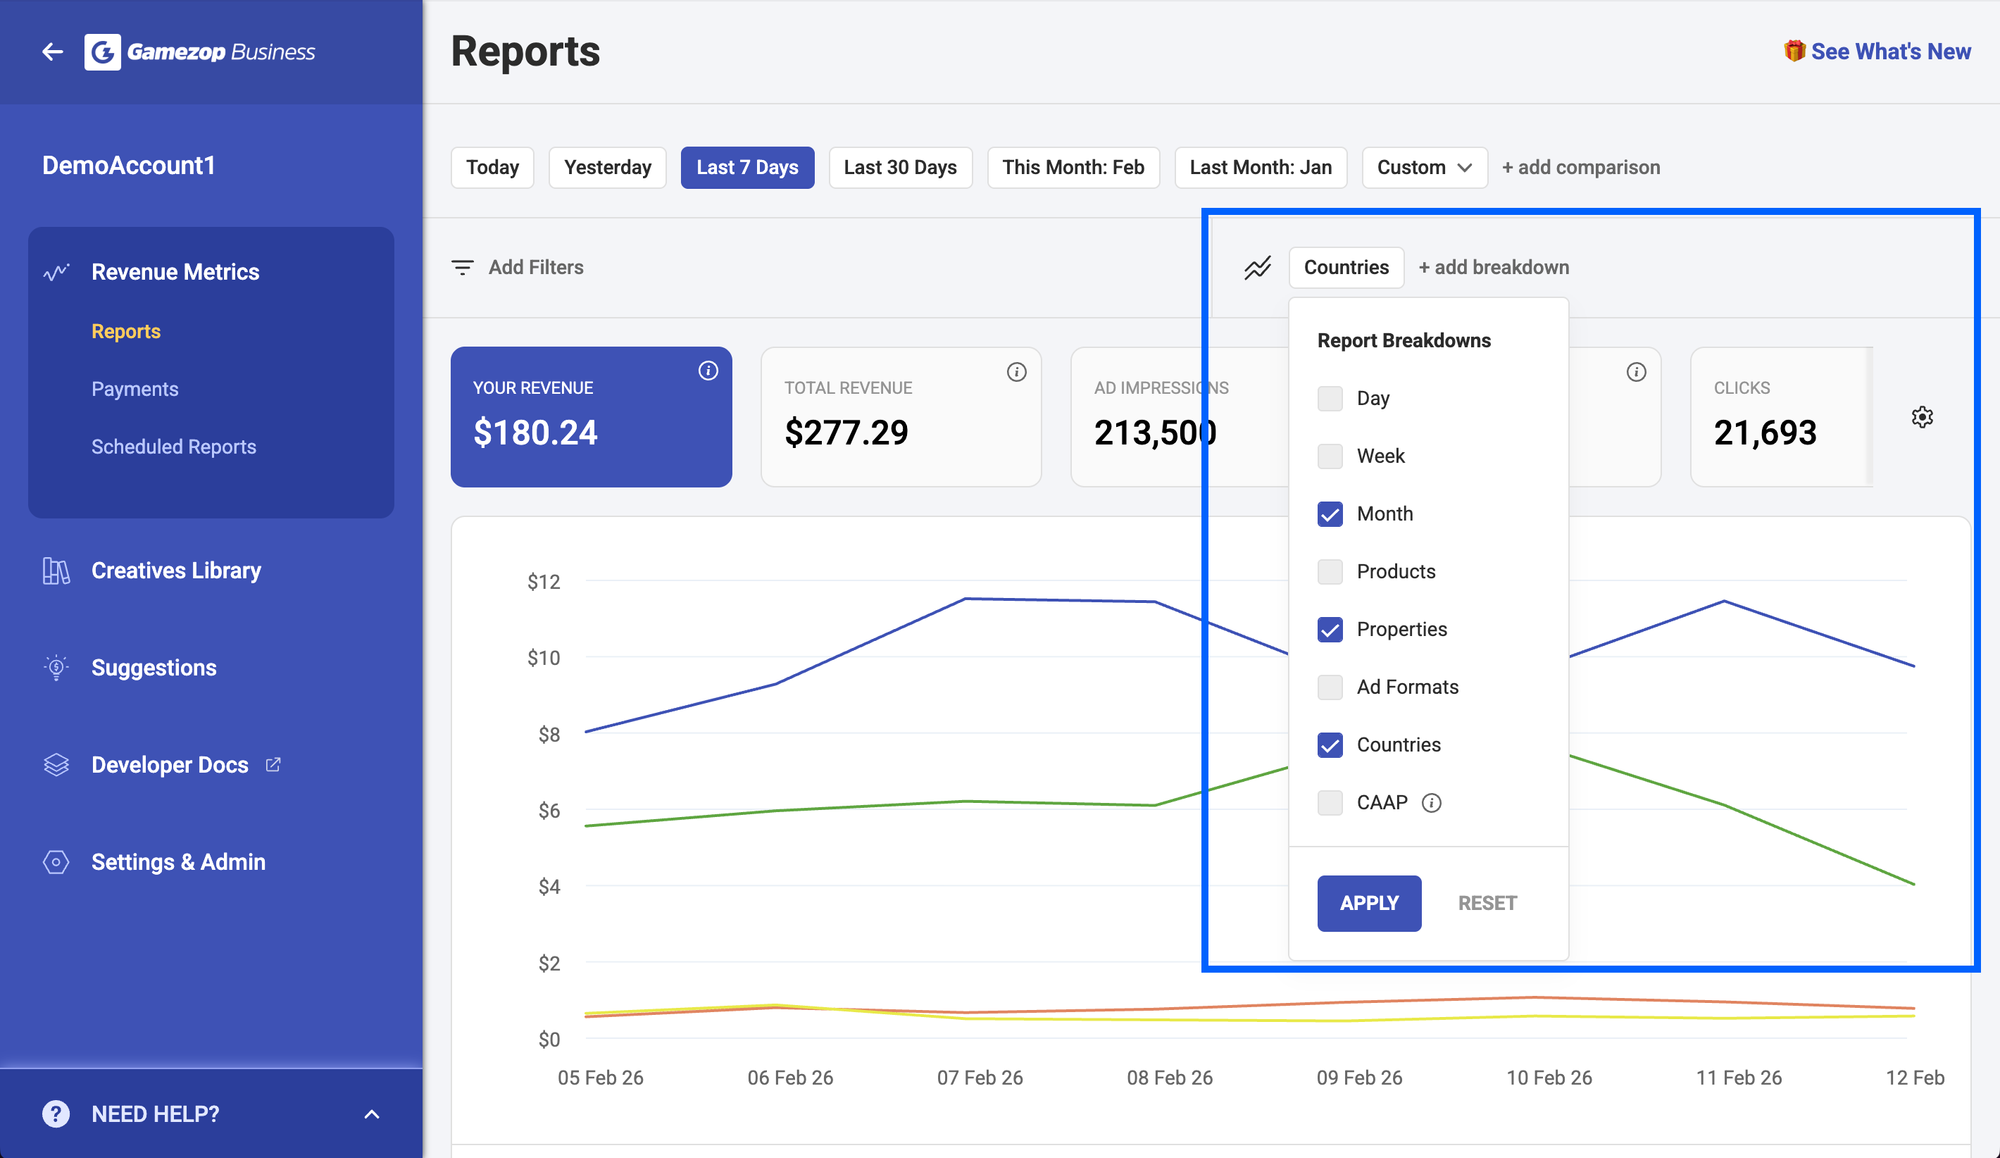
1. Apply multiple breakdowns at once
In the previous version of the reporting experience, revenue data could only be visualised using a single dimension or breakdown at a time. So if you were investigating a sudden jump in revenue and wanted to understand where it was coming from in order to double down on it, the analysis required multiple steps. Was the increase tied to a specific Property ID? Did it come from a particular country? Was it a one-off spike or an ongoing trend? Each of these questions required a new chart, since only one breakdown could be applied at a time.
With the new reporting experience, multiple breakdowns can be applied together in a single view. In the same example above, you can now apply all three breakdowns at once (Country, Property ID, and Day) and see how each performs within the same dataset, helping you move from observation to insight much faster.
For more advanced Gamezop Publishers who use our powerful CAAP functionality, there is good news. You can now bring your own custom dimensions through CAAP and visualise this data directly on the Gamezop Business dashboard. Previously, this breakdown was only available through the Ad Revenue Reports API.
2. Compare revenue between time periods
When viewing data for any time period, Publishers can use the "+ add comparison" option in the date selector to compare performance against the preceding period, the same date range from the previous year, or any custom time range of their choice.
Once enabled, the charts display the comparison period as dotted lines and the primary period as solid lines. Hovering over the chart provides a quick view of the selected date’s performance, including values for the primary period and the delta against the comparison period.
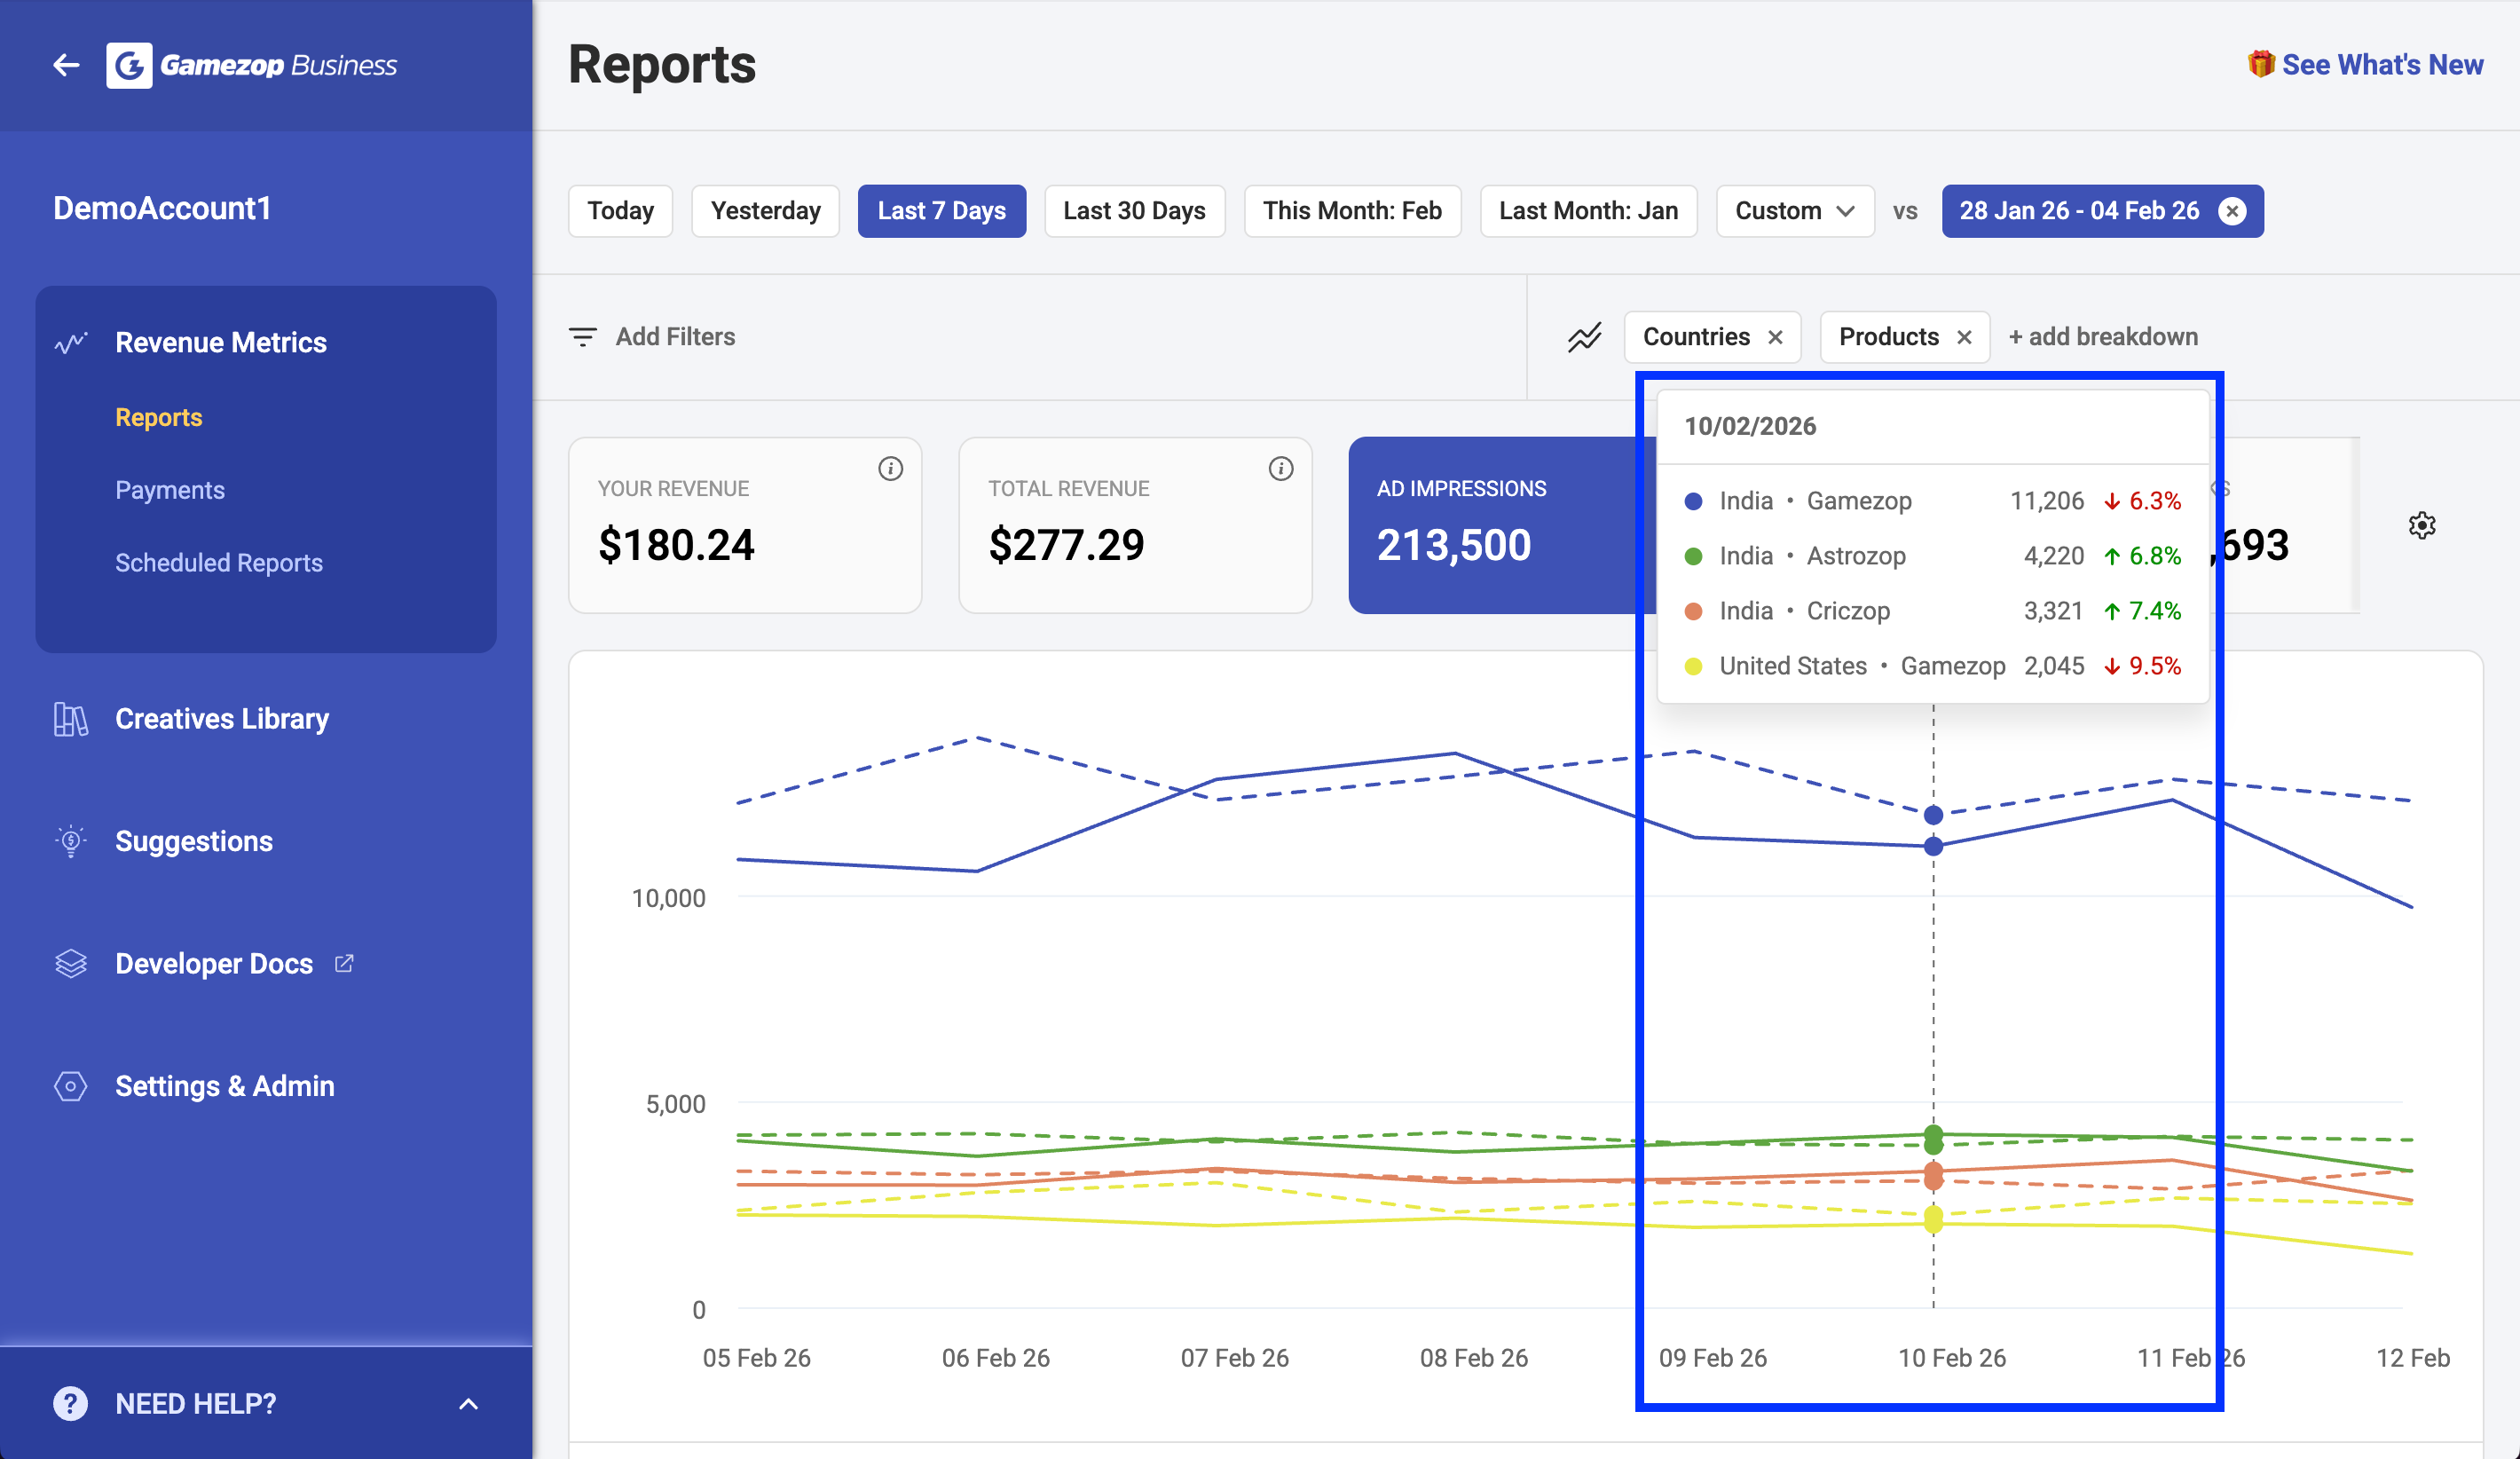
The data table below the chart also reflects both time periods, along with the percentage change between them.
This is especially powerful when combined with the multiple breakdowns feature described above. Want to visualise your data broken down by Country + Ad Format + Product (Gamezop, Quizzop, Astrozop, etc.) and compare this month’s performance to the previous month or the same month last year? The new reporting experience has you covered.
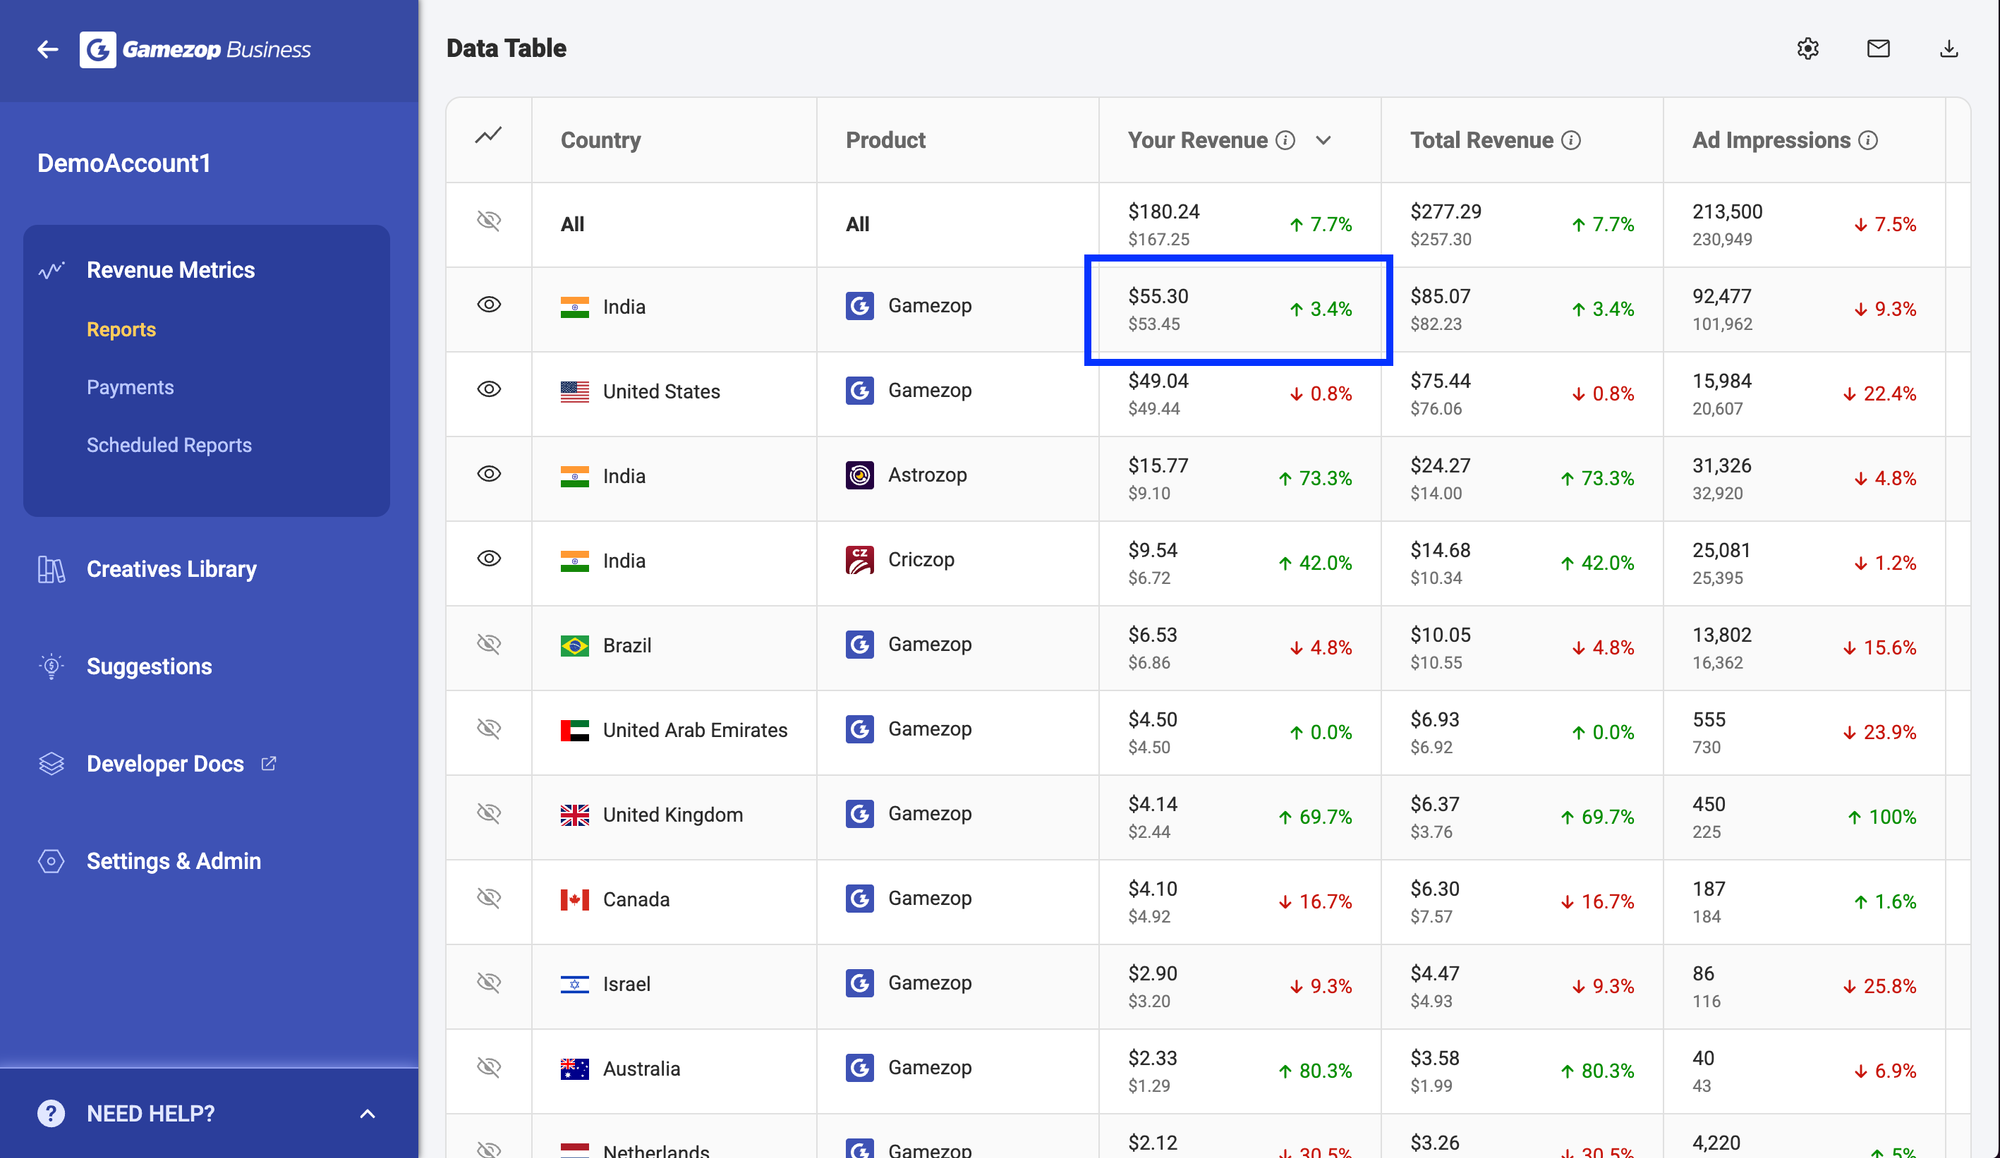
3. Do more with charts
Nothing helps spot anomalies as effectively as a chart. One clear limitation in the previous reporting experience was the limited control users had over what the chart displayed. The chart always visualised the top four rows by revenue, including the “Totals / All” row. In many cases, this meant that if revenue was heavily concentrated in a single breakdown bucket, it would dominate the chart and make it difficult to meaningfully visualise the rest of the data.
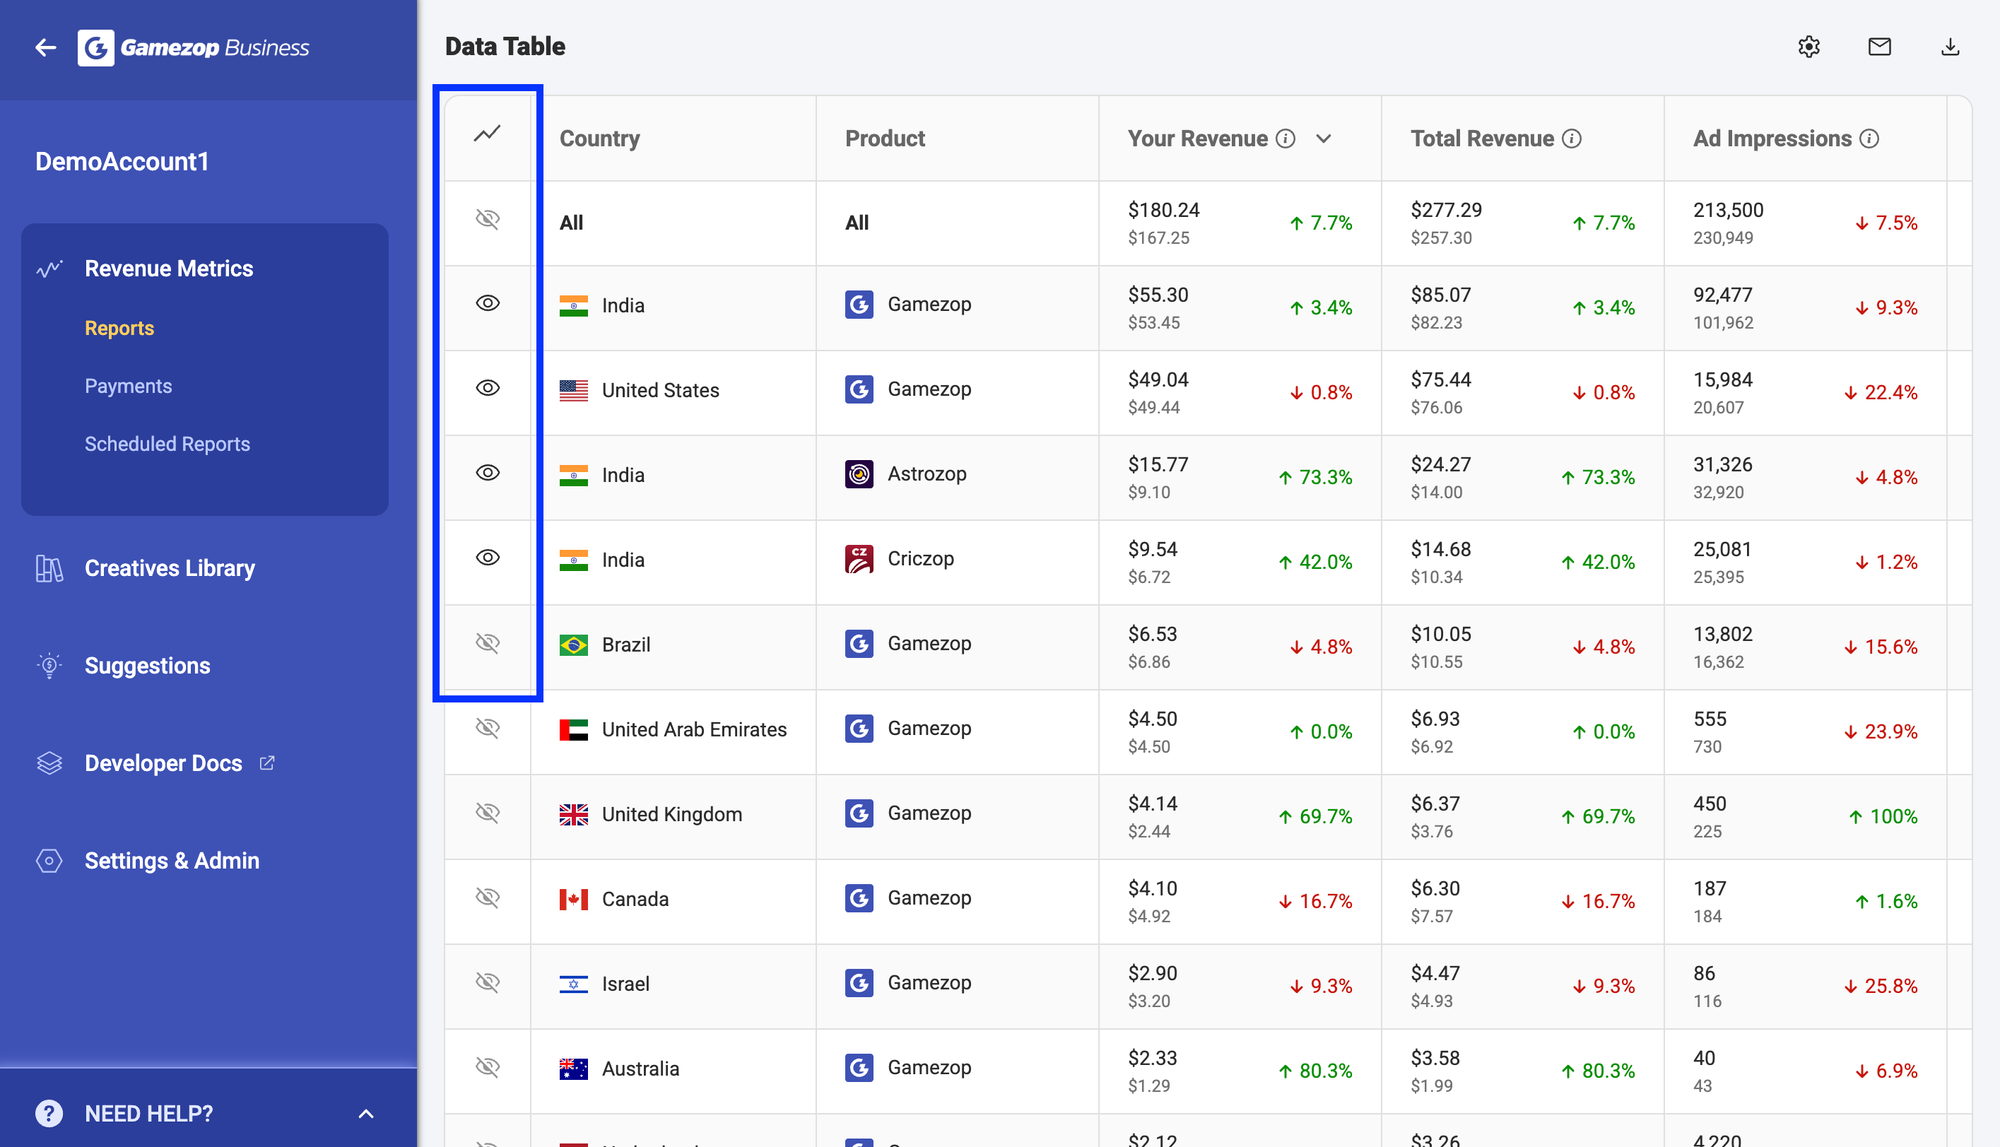
In the new experience, each row in the data table includes a handy “eye” icon. While the chart still plots the top three revenue rows by default, you can now select the icon next to any row, or multiple rows, to visualise those instead. This works seamlessly with the multiple breakdowns and data comparison features described earlier. You can group data across multiple dimensions, enable comparisons for any time period, and choose exactly which rows to visualise, making analysis far more flexible and focused.
Pro Tip 1: Hover over an item in the chart legend to highlight and focus on the corresponding line.
Pro Tip 2: The “eye” icon does not appear when your breakdown includes Day, Week, or Month, since plotting a row with a time dimension would result in a single data point on the chart.
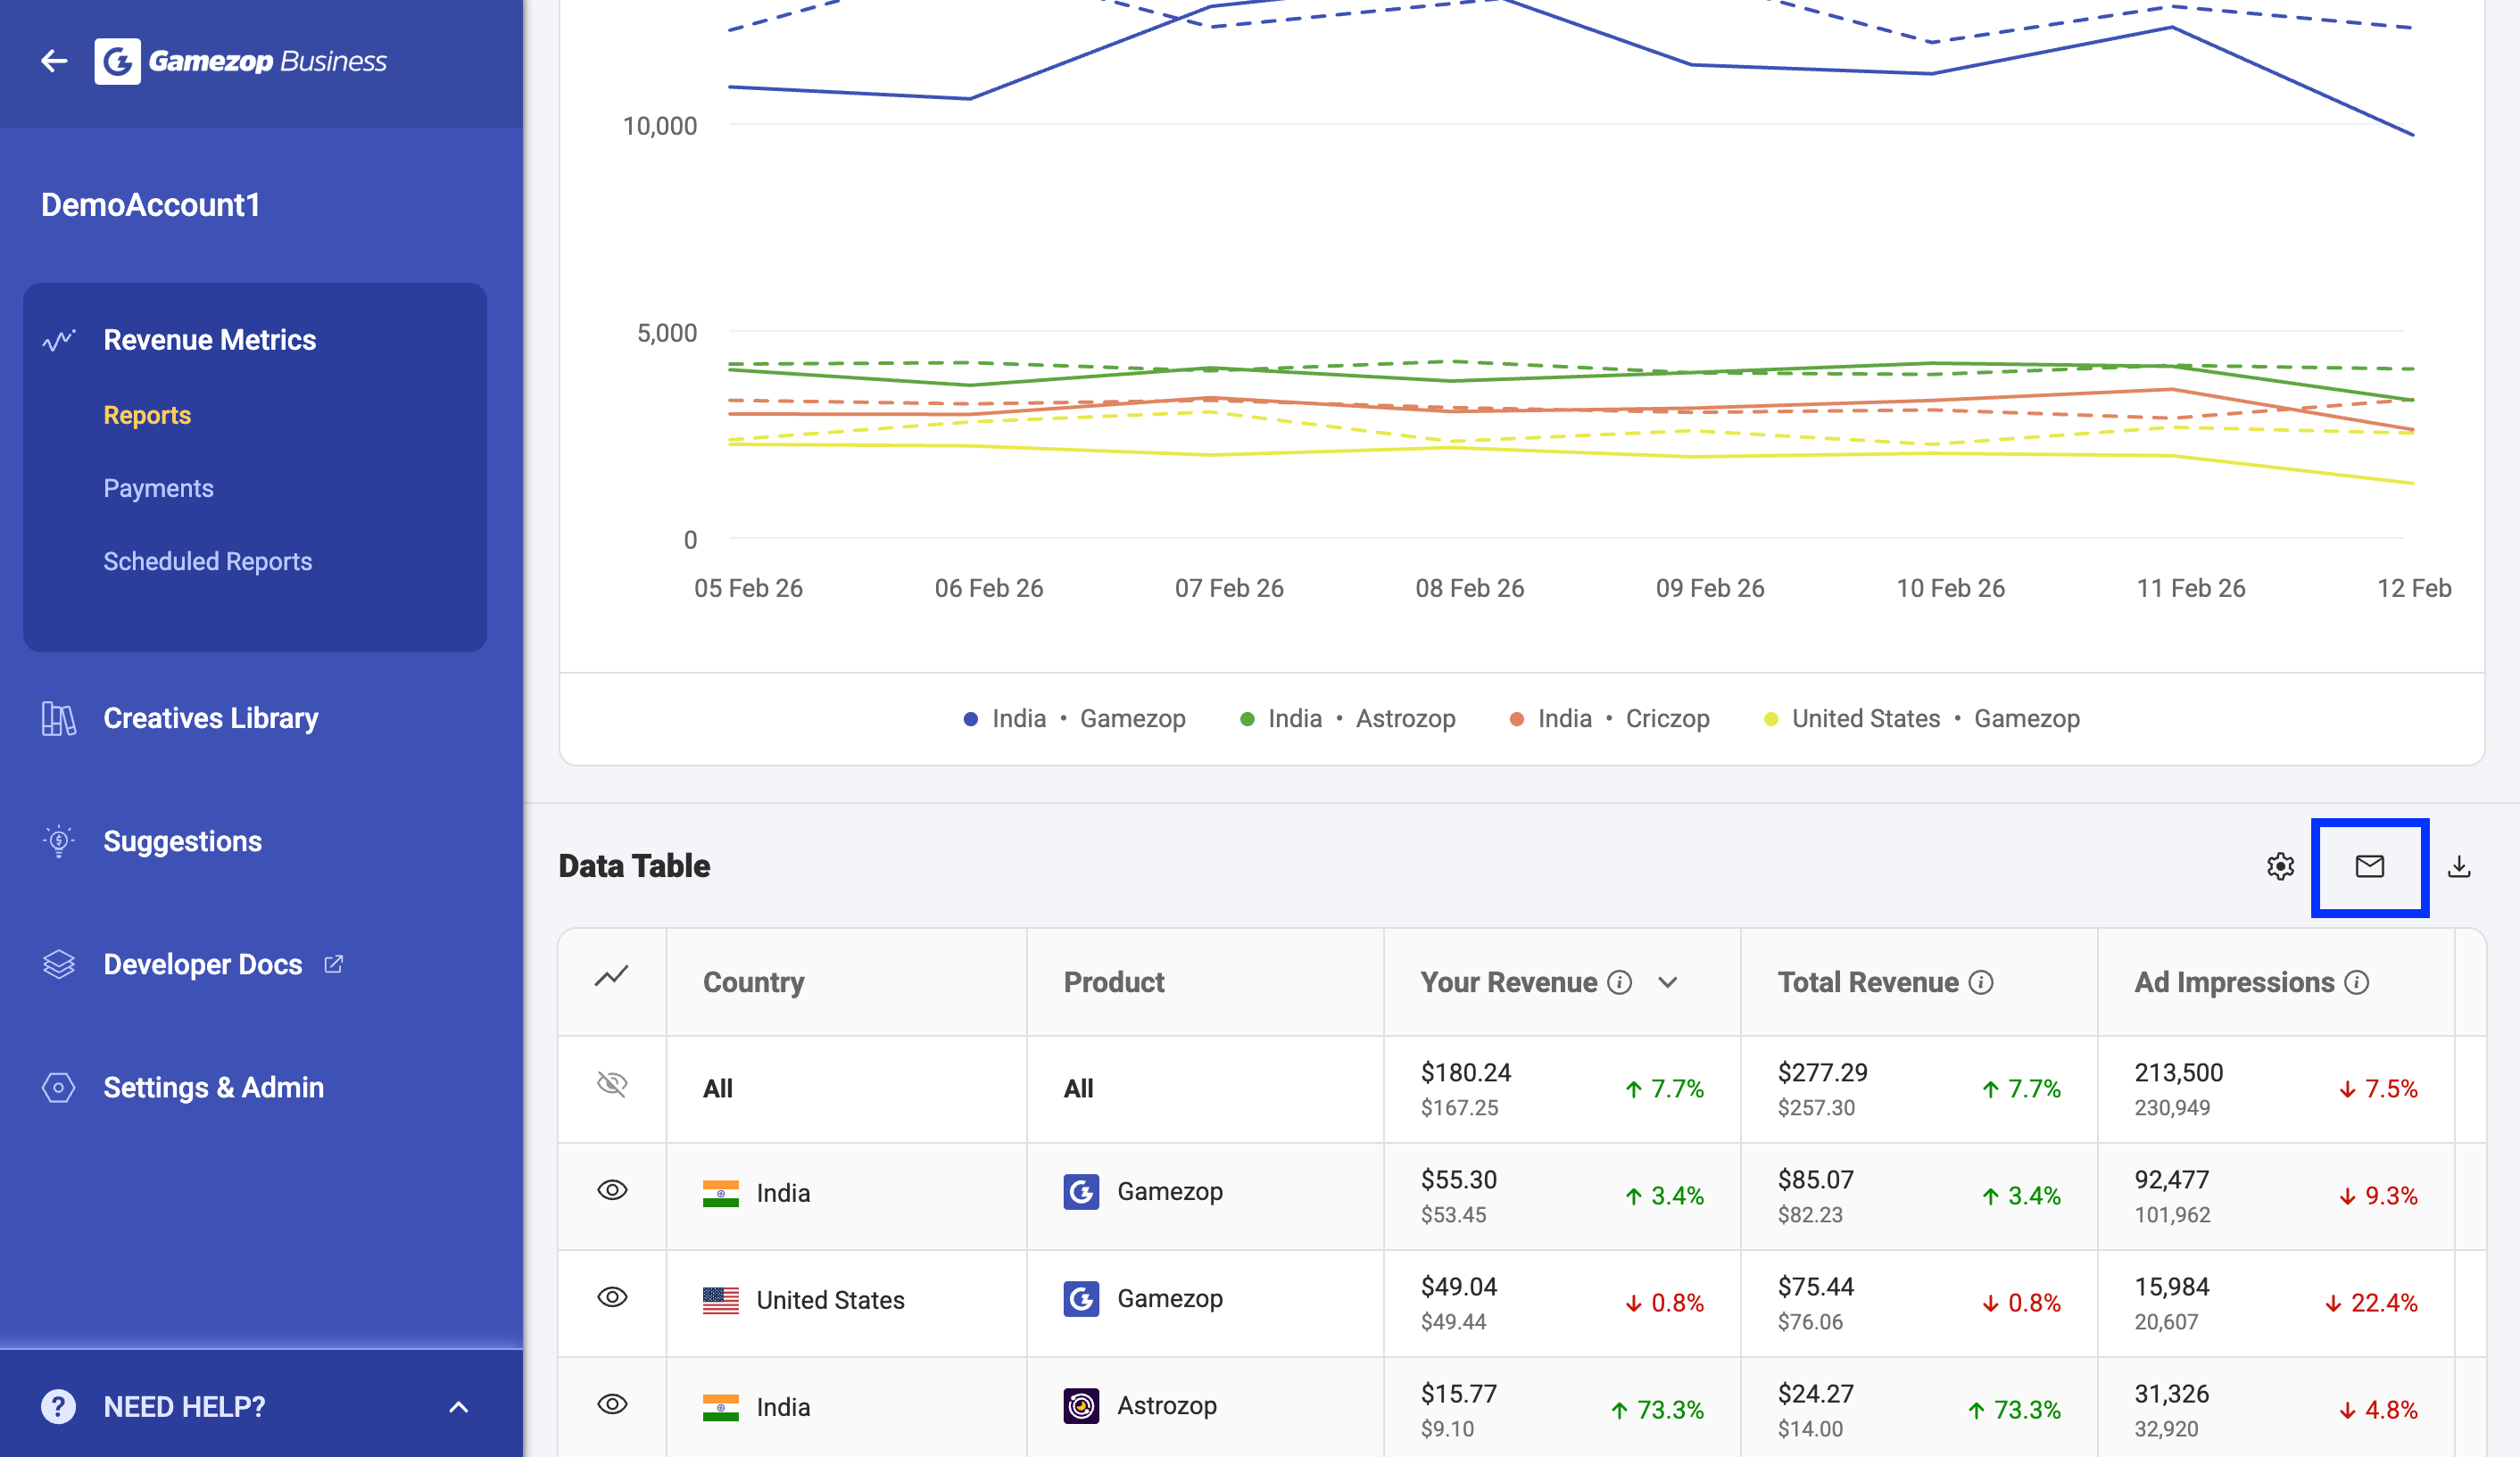
4. Send yourself a data snapshot
At Gamezop, earning and maintaining the trust of our Publishers is extremely important to us. Over the years, some partners have asked whether revenue data is ever changed after it has been reported. The answer has always been no, and this continues to be our commitment.
With the new option to email yourself the data you are viewing, you now have a simple way to retain a snapshot of reported data. When you click this icon, an email is sent from no-reply@gamezop.in to the email address associated with your Gamezop Business dashboard account, capturing the data exactly as it appears at that moment. You can later revisit the dashboard, apply the same filters and breakdowns, and compare the data with the snapshot in your inbox.
It is a small feature, but one that reflects something fundamental to us at Gamezop: integrity and a partner-first approach.
Note: Data for the current day (day measured in GMT +5:30), may change during the day due to reporting fluctuations from partner ad networks.
What's next?
If you have thoughts or suggestions about these updates, we would love to hear from you. You can reach out to your Gamezop Account Manager or write to us at helpdesk@gamezop.com
As for what’s next on the Gamezop Business dashboard: since this is a Gamezop product blog, it only feels right to answer that question with a small game:
I track what happens after play,
I save your view for another day.
I reach you even when you’re away,
With stories your numbers want to say.
What am I?
Solve the riddle to know what's coming next!
We are really excited about this update, and hope that this makes the Gamezop experience a little bit better for our Publishers! Over 10,000 apps and websites around the world benefit from our revenue-sharing program each month. If you have an app or website and want to know more, contact us here.
We can't wait to see what you'll do with our games